How to visualize your SCADA diagram at thethings.iO in 3 steps
Imagine you have a number of different Internet-connected devices that fit together within one system. This could be a plant with humidity, light and pH sensors or, on a larger scale, a connected home system with numerous connected devices or a factory where you can monitor and control the valves, faucets, among others. The possibilities are endless, but either way, these instances can all be easily monitored through the use of a SCADA diagram.
A SCADA (Supervisory Control and Data Acquisition) diagram allows you to create a visual representation of your system’s processes and monitor them in a unique, dynamic diagram. Created in the ’60s, SCADA systems have evolved as one of the most important representational systems for industrial and infrastructure processes.
And now you can create your own SCADA diagram on thethings.iO dashboard! By the way, this is just the first version of the SCADA diagrams at thethings.iO dashboard, so we will update them soon. Follow these three simple steps to make a customized SCADA diagram.
Step 1: Go to the Dashboard and Create a Widget
Before you can start making your own SCADA chart, you need to sign up at thethings.iO and connect a device! If you already have an account and a connected thing, all you need to do is to log in. If not, click here to learn how to connect your first thing in 6 simple steps.
Once you are logged in, you will see a “meter” icon on the left-side navigation panel; this represents your customizable dashboard. Go to the dashboard and select the “Edit Dashboard” button in the top right corner. Now you can edit all your widgets and organize them any way that you prefer.
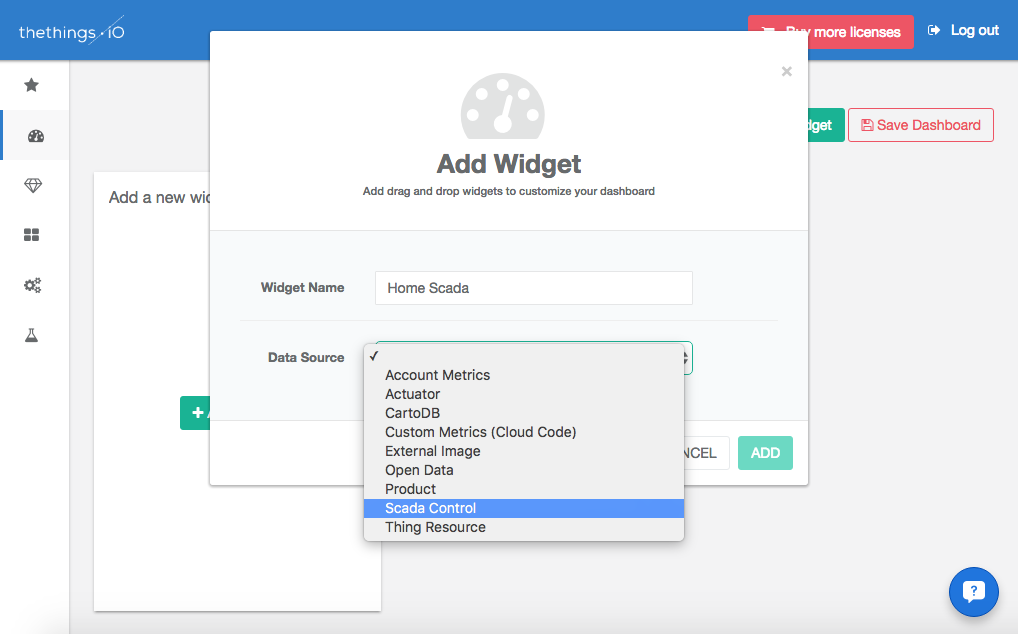
Scroll down until you see the “Add a new widget!” container and click the “Add Widget” button. A window will pop up in which you must type the name of your widget. Select the “Scada Control” option from the Data Source drop-down menu and click “Add” to create the widget.
Step 2: Adding Your Own Image
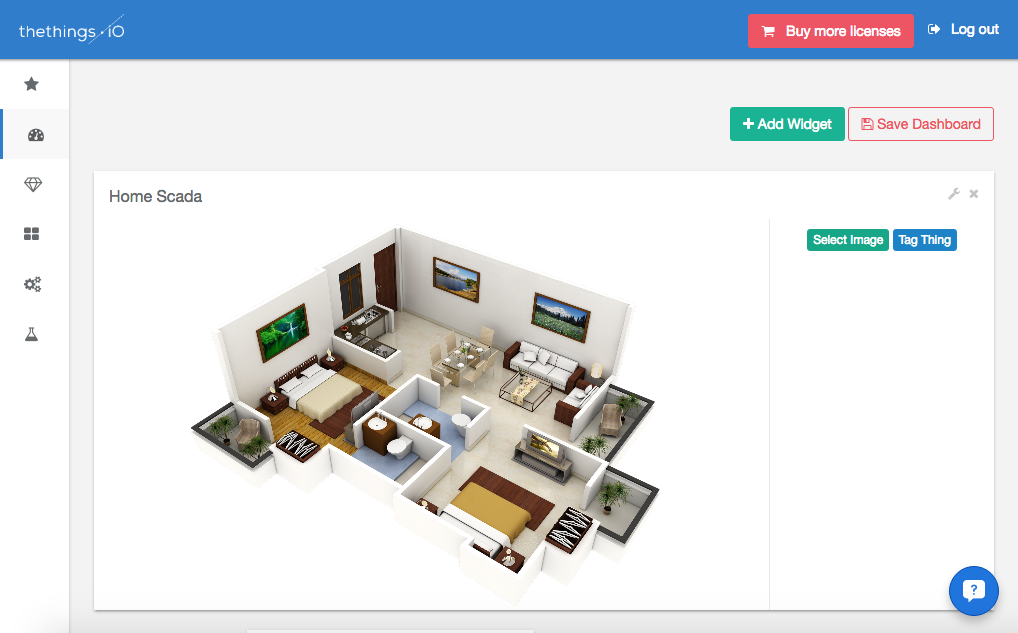
Now that you have created the widget, it’s time to personalize it with an image of your system! Scroll to the SCADA widget that you made in the last step and click the “Select Image” button. Upload your desired picture and resize the widget to fit your preference.
Step 3: Tagging Things on Your SCADA diagram
Once you have the image of your system uploaded, you must place your things on it! For example, I will be placing a “light” icon over the location of the lamp in the house diagram. You will place the things you want to monitor in their correct locations on your own image.
To do this, click the “Tag Thing” button on the right side of your widget. Hover the crosshair mouse over the location you want to tag and click. Select the Product, Thing and Resource of the item that you are trying to represent. Next, select an icon to represent your thing. You can choose from specific icons like a microphone or a car, or opt for a more general icon like a circle.
The final step to tagging your things is the optional Color Management feature. Here you can choose to change the color of your icon based on its last sent data value. A certain color can be applied to either a range of data values or one specific value. This feature makes the monitoring of your connected devices especially easy. With only a glance you can tell the status of your things.

Click the “+” button to add as many color management options as you desire and then click “Add Thing” to finish tagging your thing. Continue tagging different things until all the ones you wish to show are displayed on the SCADA diagram.
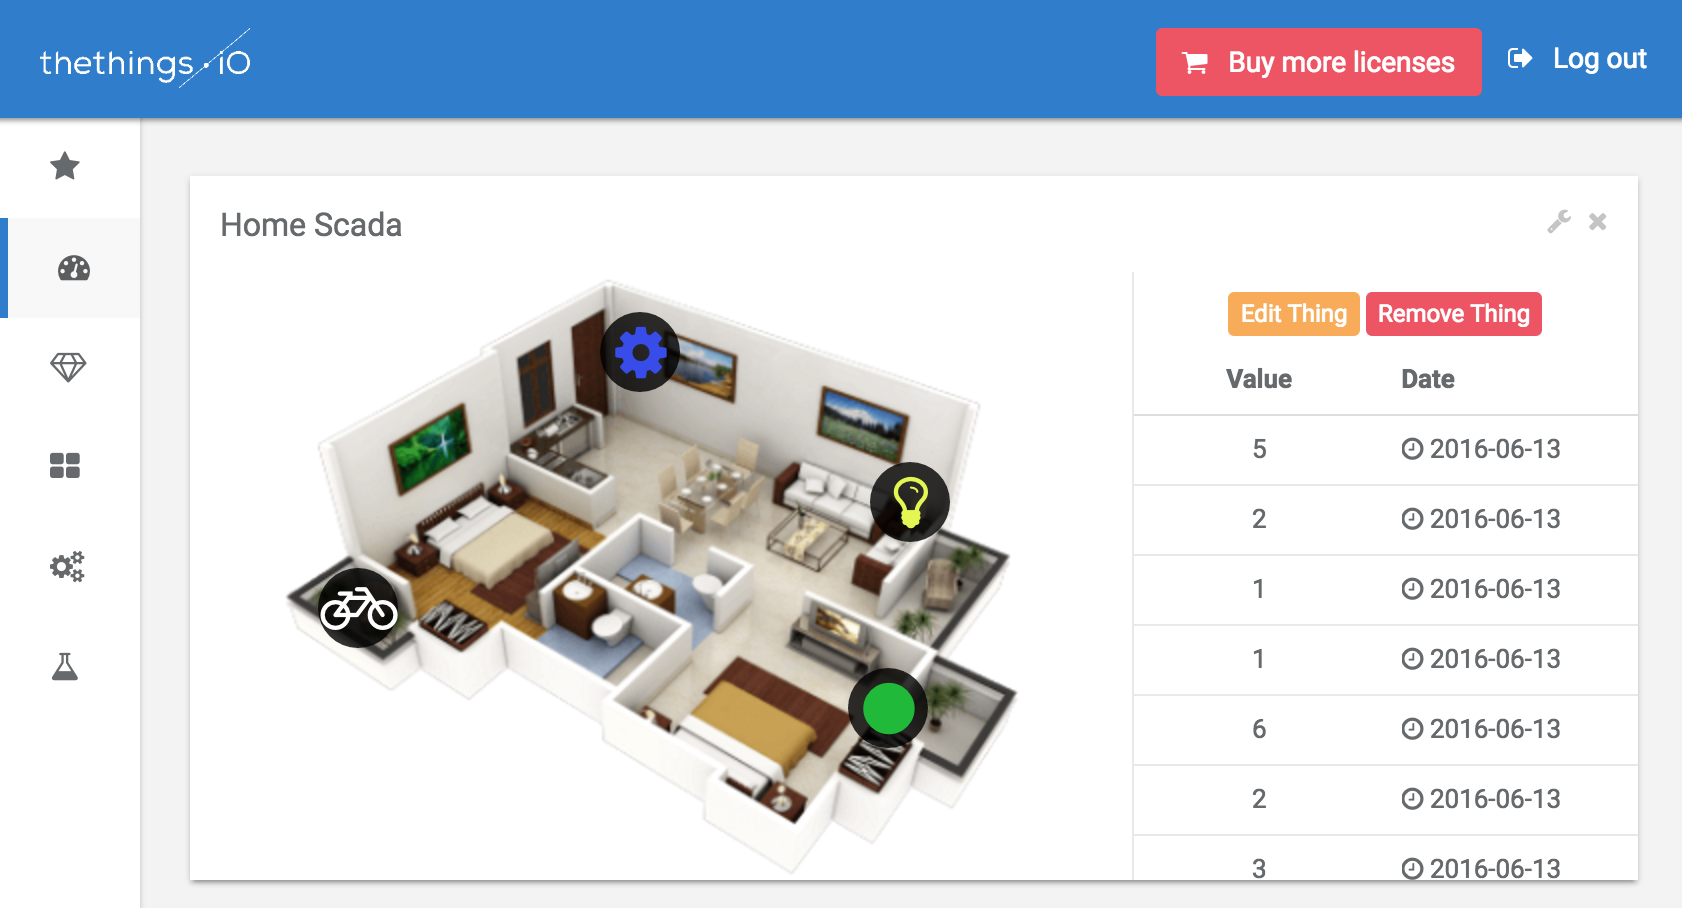
After you have tagged all your things you are finished! Click the “Save Dashboard” button and view your new SCADA chart in action! You can even click each icon to view a list of the last values along with the date.
Got an IoT product you need to connect? Head over to the simplest IoT platform on the market and sign up now.

