4 Steps to Build Your IoT Dashboard
As you know, thethings.iO is the Internet of Things platform that allows you to connect things to the Internet quickly and easily. We allow you to monitor and manage your networked devices in real-time and get flexible analytics reports. And the product goes further, as you will see in this post about the IoT Dashboard that we deployed some weeks ago.
Step 0: Sign Up or Log In at thethings.iO
The first thing you need to do is, in case you have not registered yet, create a new account and Sign Up to our platform. Otherwise, if you already have an account, you just need to Log In to move to your IoT Dashboard.
Primarily you’ll notice that when you first access to your IoT Dashboard, a new window appears to introduce yourself to the platform and specifically, to the IoT Dashboard. The message is the following one:

Step 1: Starting with thethings.iO IoT Dashboard
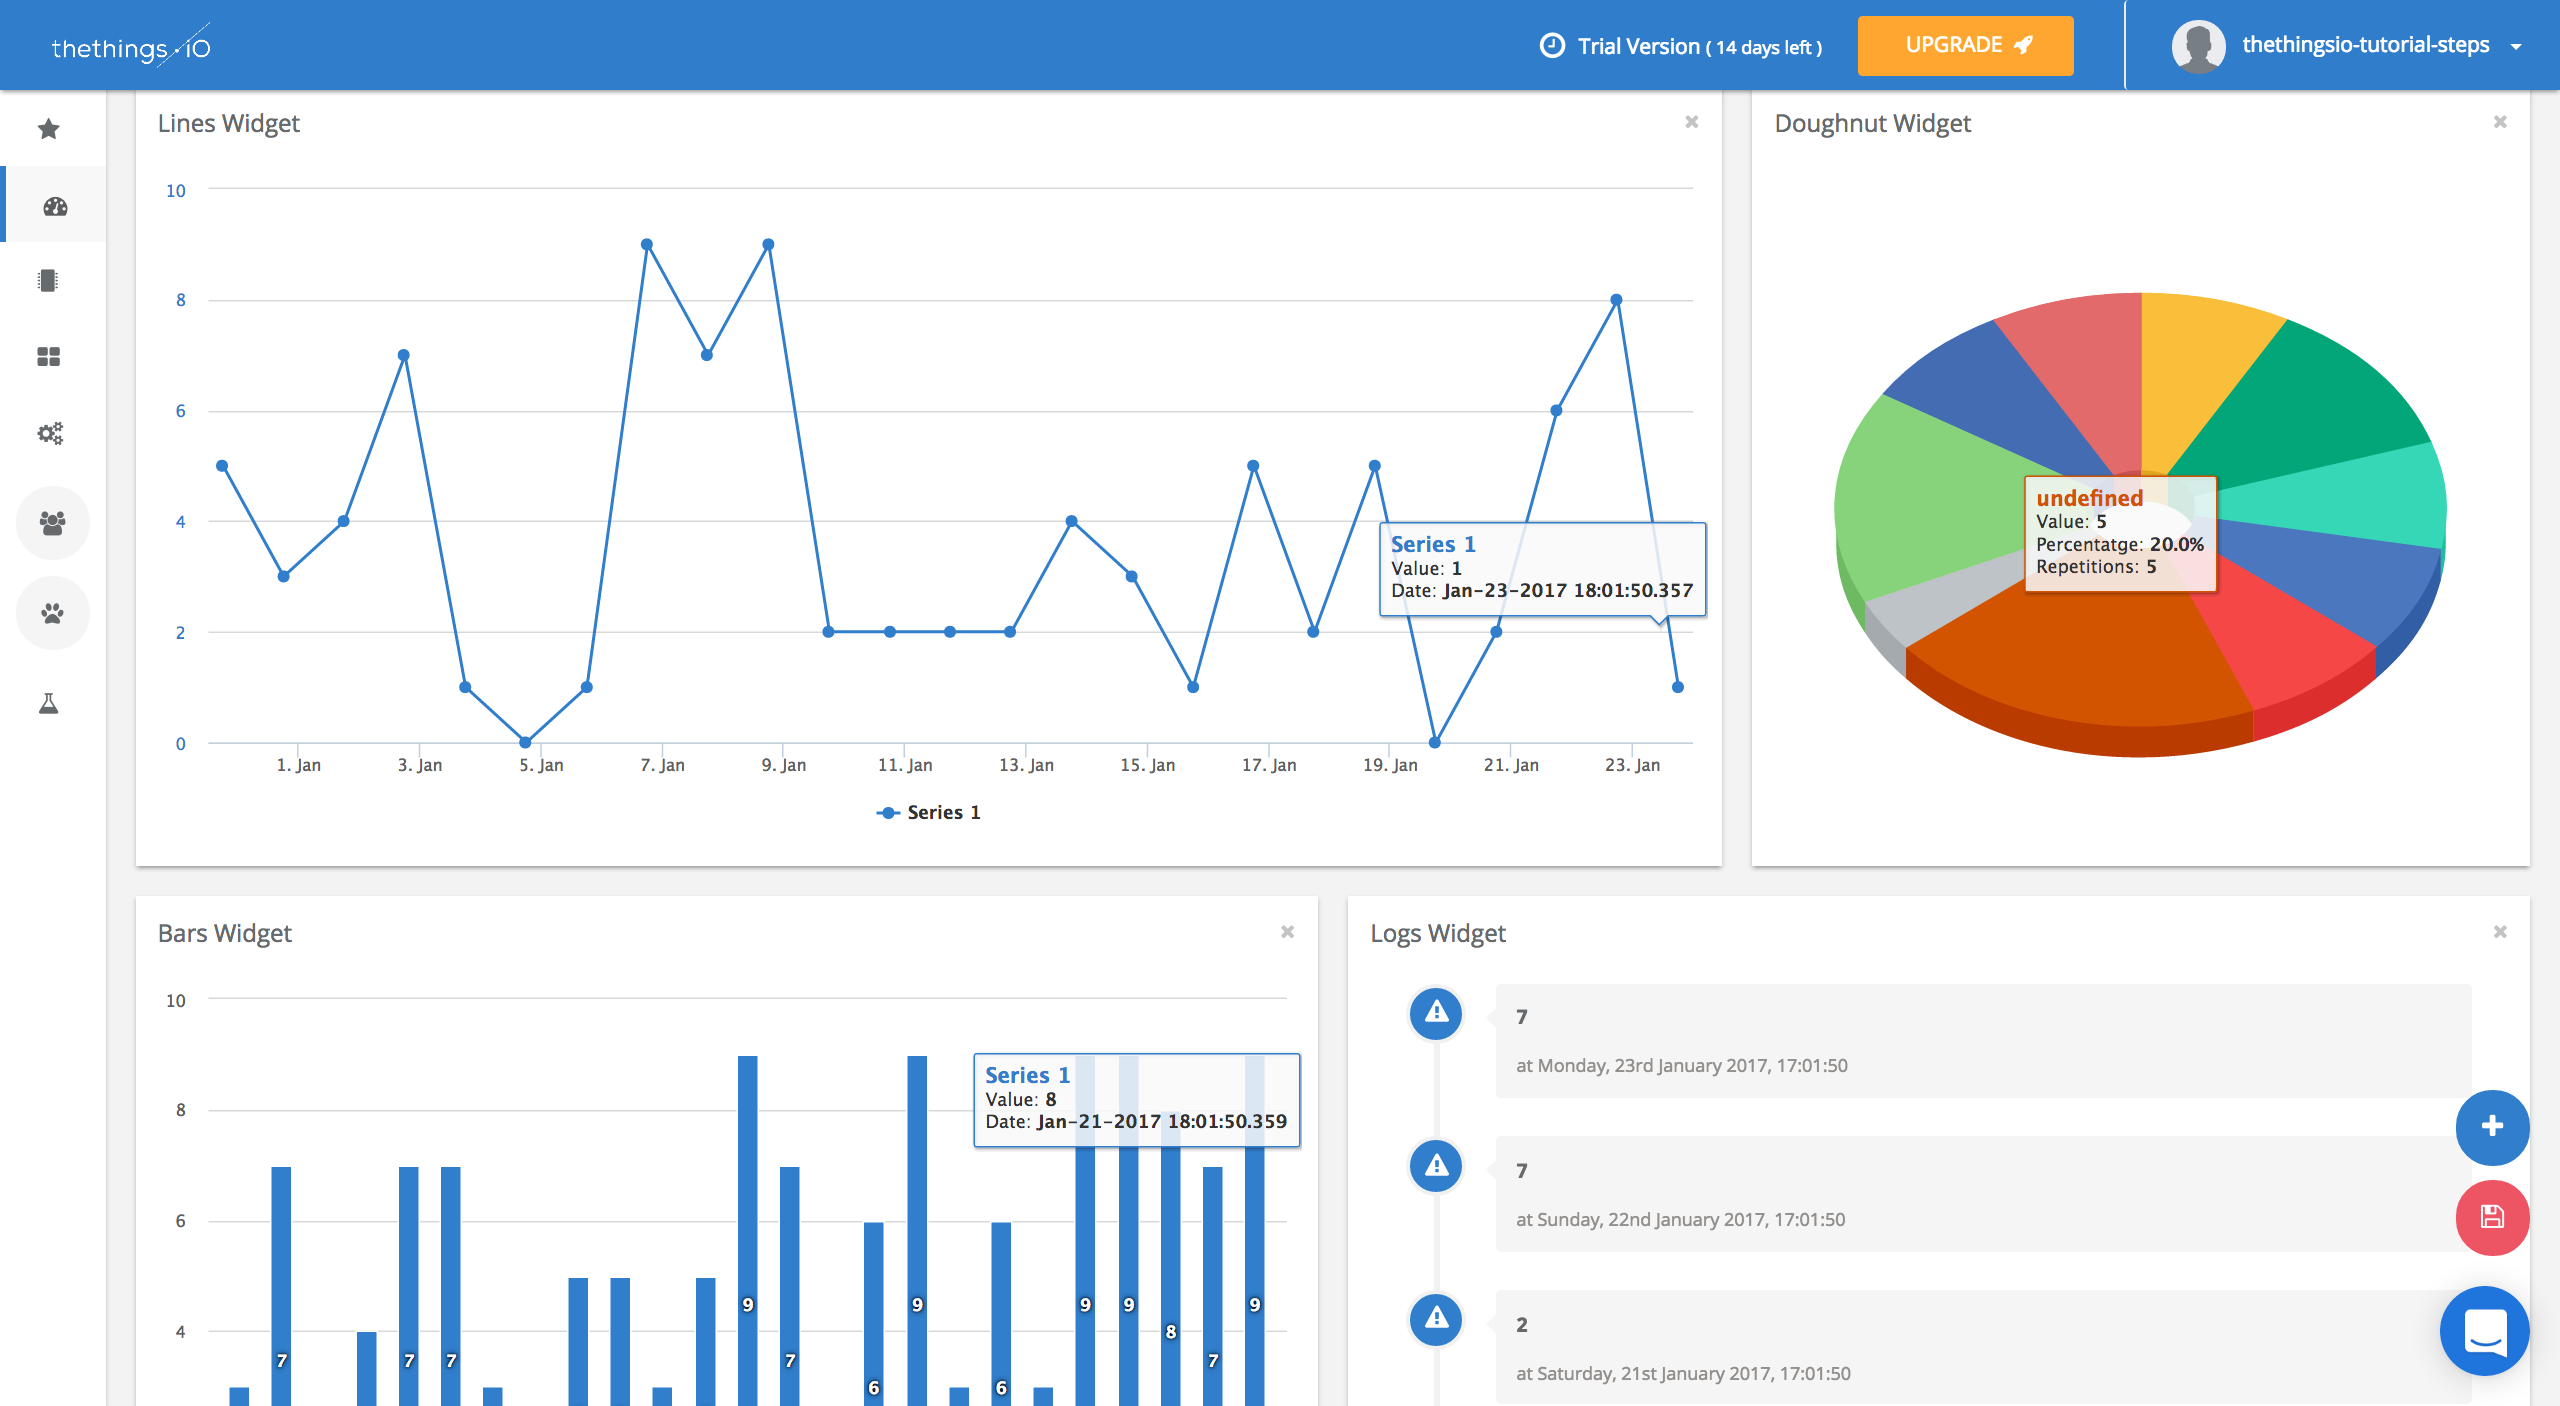
The IoT Dashboard is the place at thethings.iO where all the data generated by your things will be displayed. Depending on which kind of information you want to see you may prefer one widget or another. Before start building your IoT Dashboard you should have at least one thing connected using our platform. If you want to start connecting things fast, you should not miss this quick guide of how to connect your first thing in 1 minute! Why? Because you need data to display!
Once you have done that, we can move to the option “Edit Dashboard”, on the lower right section of your screen. The icon is yellow and this tool is the one we are going to use most during this post, so keep an eye on it!
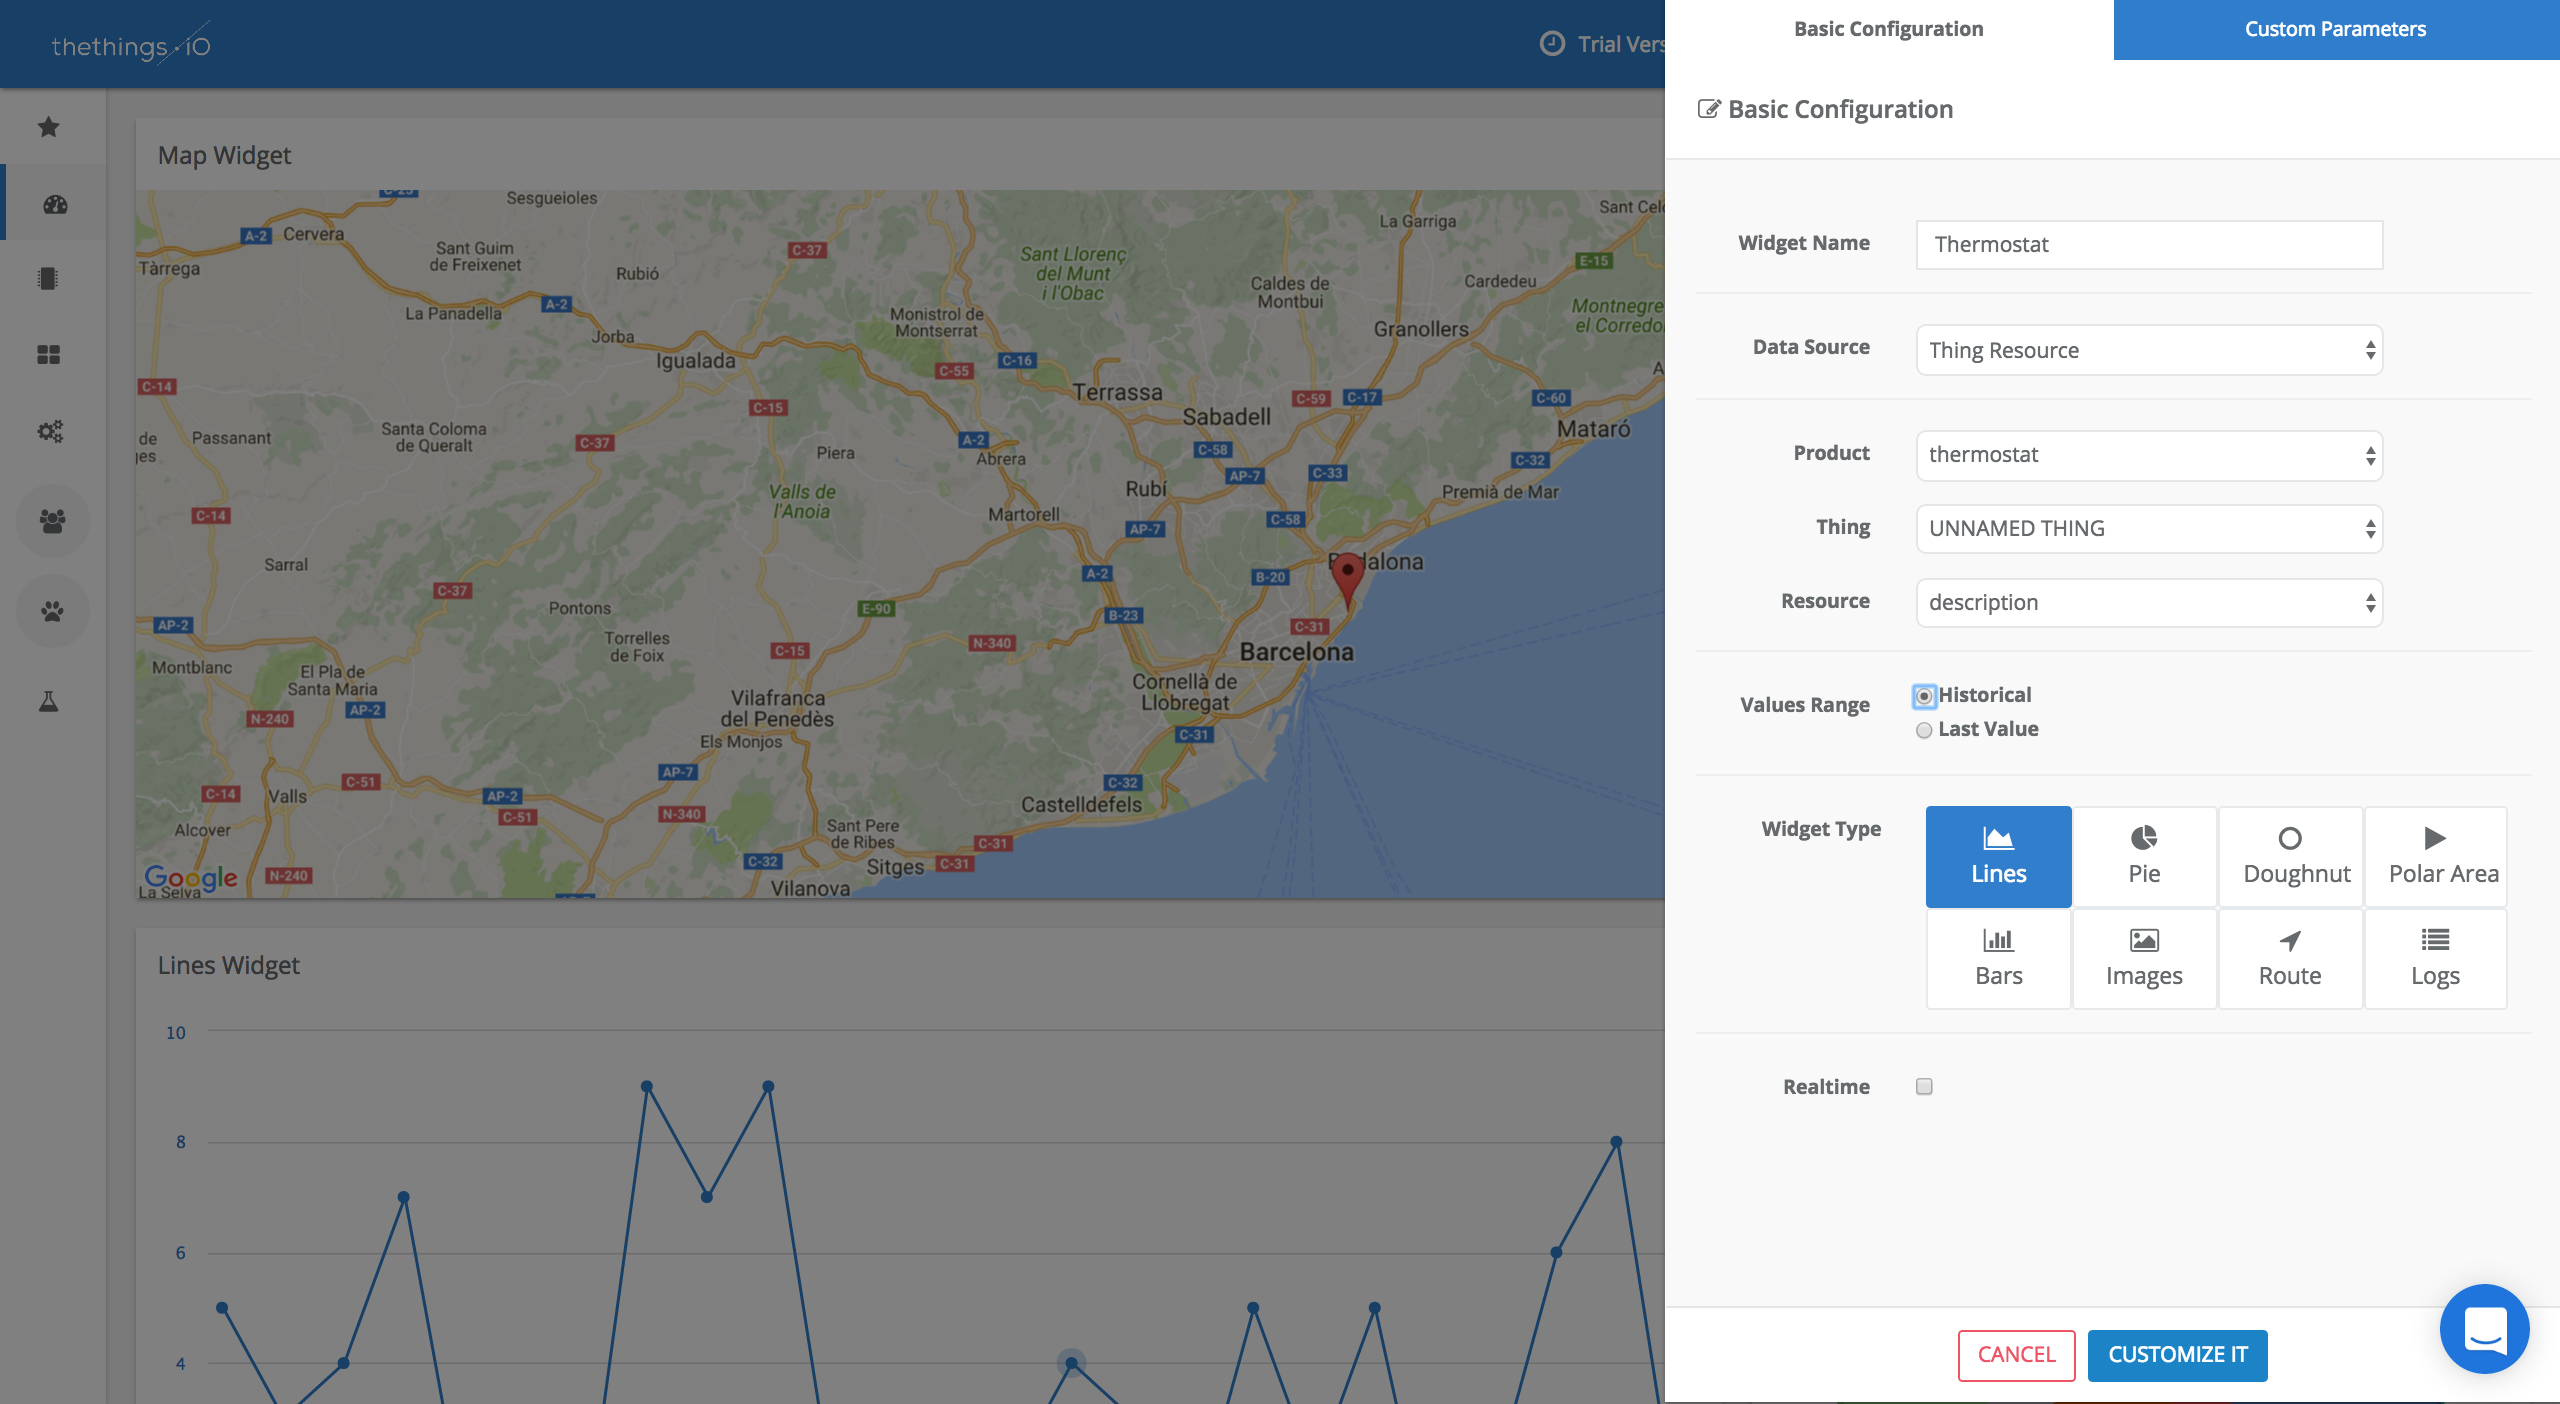
Step 2: Create a Widget
Above the yellow “Edit Dashboard” there is a a blue “Add Widget” icon. So now we are going to click on it and a pop-up you will have to work with will appear. Your screen should look like this:

- Map
- Doughnut
- Lines
- Bars
- Logs
- Value
- Pie
- Polar Area
Depending on the option you choose in “Values Range” you’ll find one or the other.
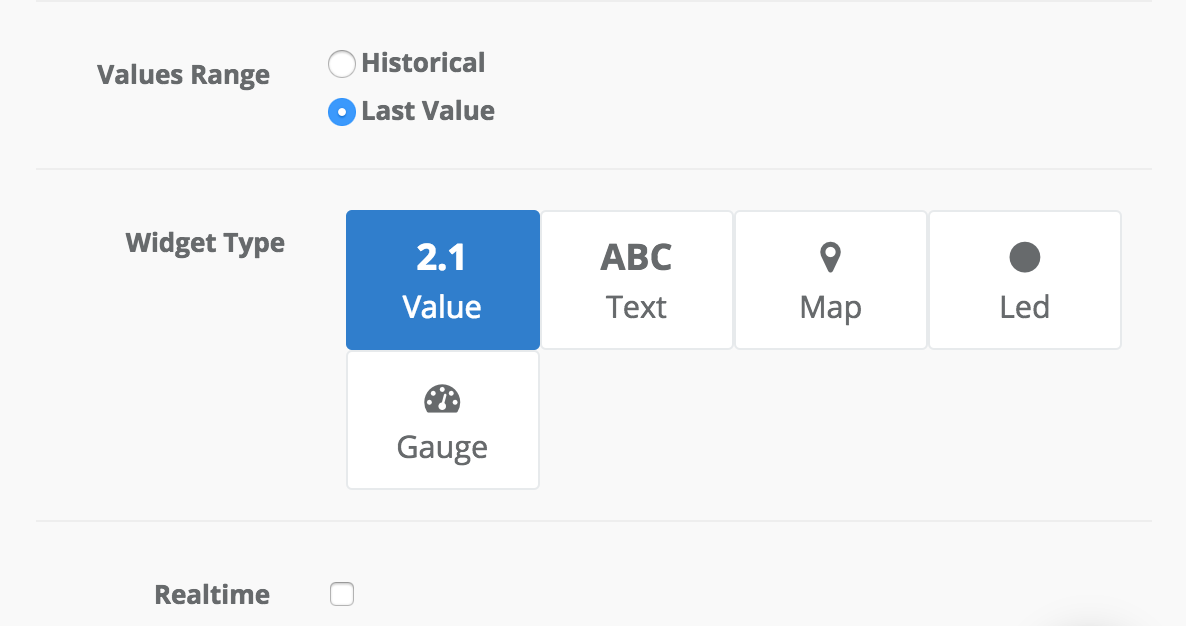
Finally, you can add your new widget to your IoT Dashboard.
Step 3: Customize your IoT Dashboard
One of the coolest things you can do with your IoT Dashboard is to add, remove and replace your widgets easily. To do it you just need to click on “Edit Dashboard” again and just touch one of the widgets. Now you can change its place just moving it, change its size, and also the kind of widget you want it to be!
Look the changes we have done in our example screen:
Once you finish editing your IoT Dashboard do not forget to save it!
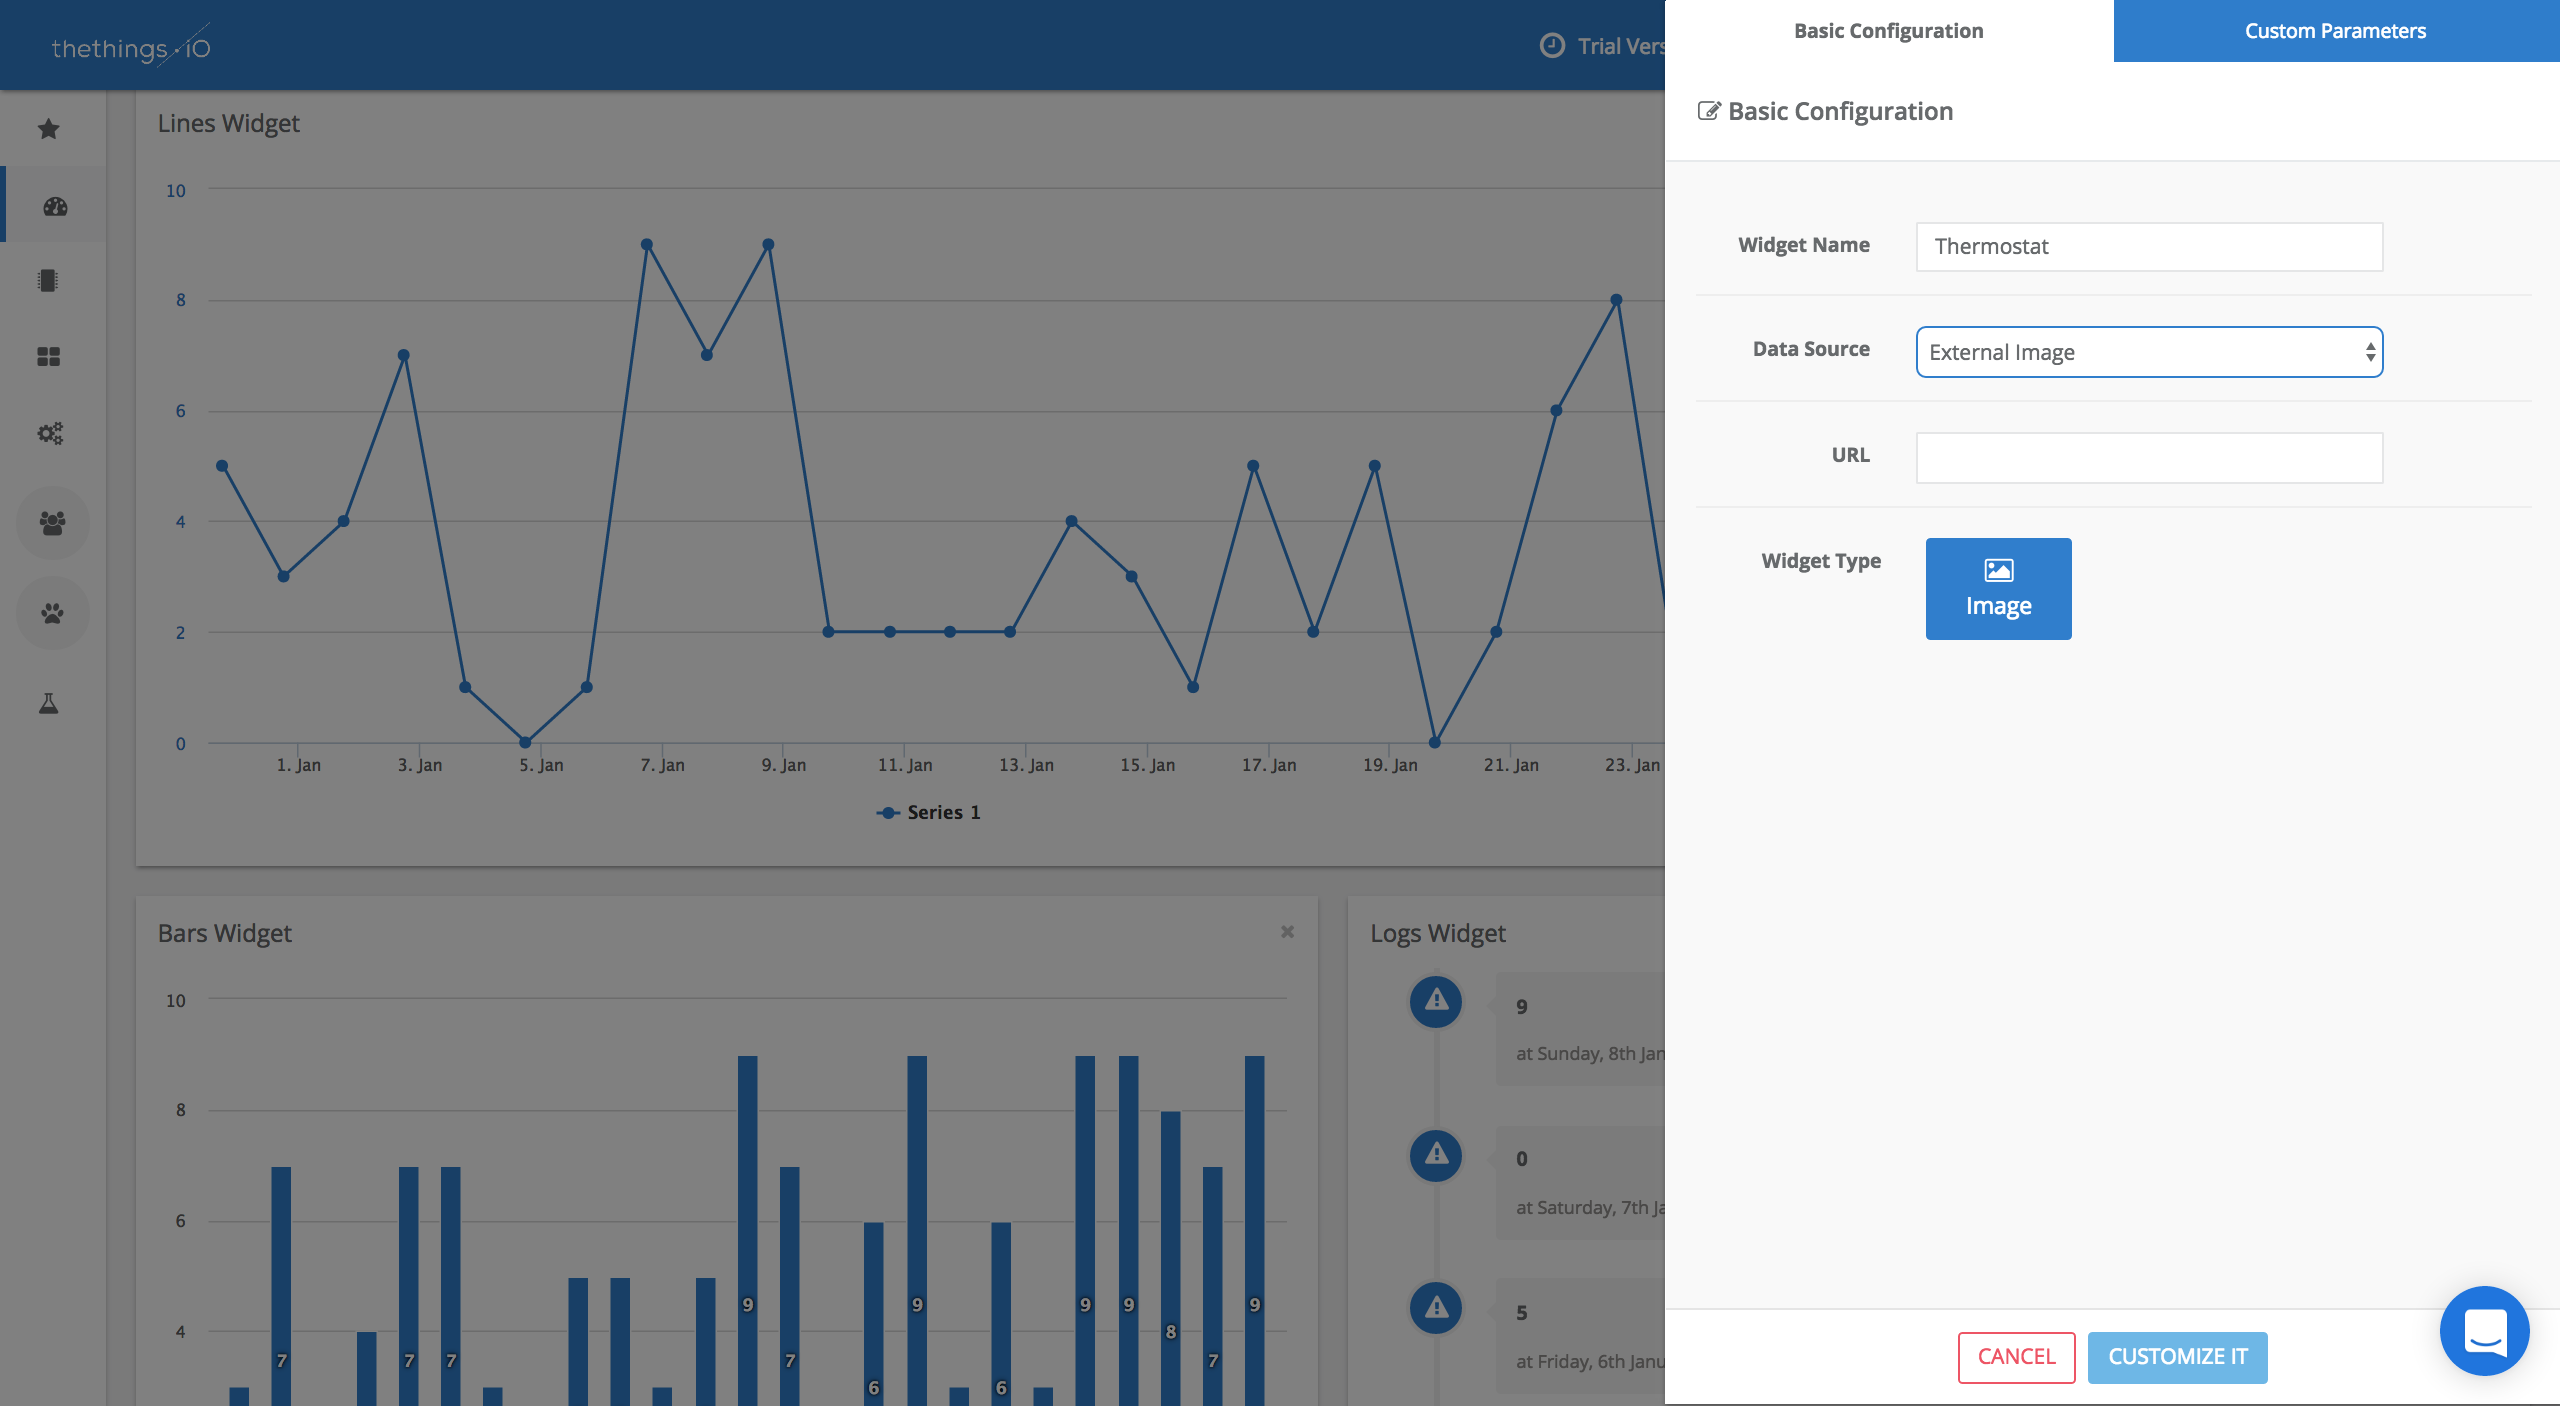
Step 4: Create an Image
You may think that’s all we can offer, but right now we do offer more! Now you can add images to your IoT Dashboard. How?
- Go to Edit Dashboard button and Add Widget.
- Once you are in the pop-up window, in the “Data Source” field you have to choose the option “External Image”. Here you will be able to add images from your computer or directly from an URL.
3. Add your Widget to your IoT Dashboard.
Step By Step Video Tutorial
You can also check these 2 tutorials in which we explain how to build and customize your IoT dashboard. In this case we use a Thermostat we’ve recently connected to thethings.iO to show you how it works.
And that’s it. Isn’t it easy? Start connecting things now with thethings.iO and get cool customizable IoT Dashboards as the one we have shown you here.
And do not forget to follow us on Twitter in order to keep you posted about the IoT World and the latest news of thethings.iO.